

SaaS · Embedded BI
7,000+
active users on a multi-tenant BI product, with standardized KPIs and embedded analytics — it became a new recurring revenue line.
A system that doesn't exist yet, systems that don't talk to each other, reports built by hand, numbers that don't add up: we get to know your operation and build, with technology and data, the whole path, from the first data point to the decision.
Product dashboards
Interactive dashboards with demo data. Click the buttons inside each dashboard to open the analyses, and swipe sideways to see the other areas.
On your side
You don't need to understand data or systems. Tell us what is holding your operation back; from here on, we solve it together.
How it works in practice
The dashboard in the pocket of whoever decides: the number, the explanation and the conclusion written by the dashboard itself.
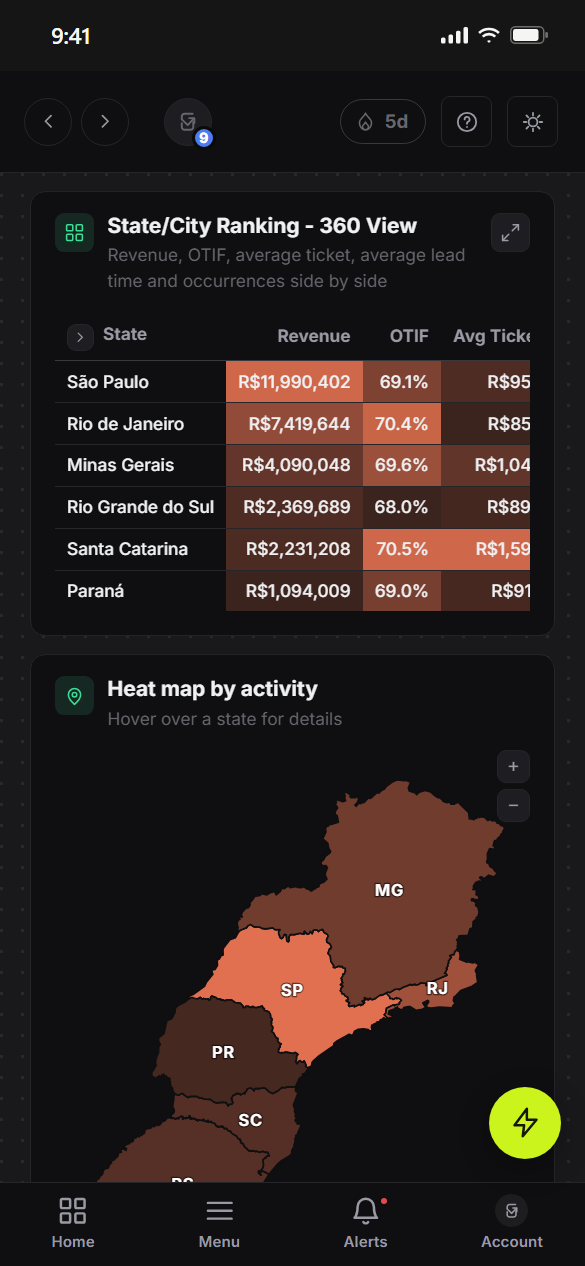
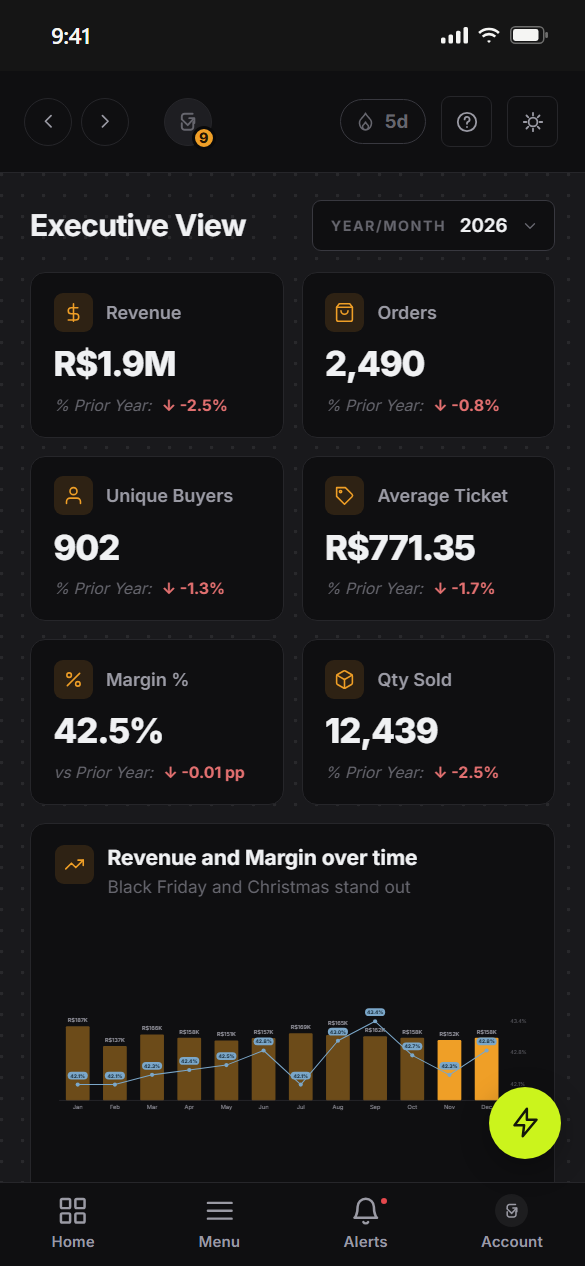
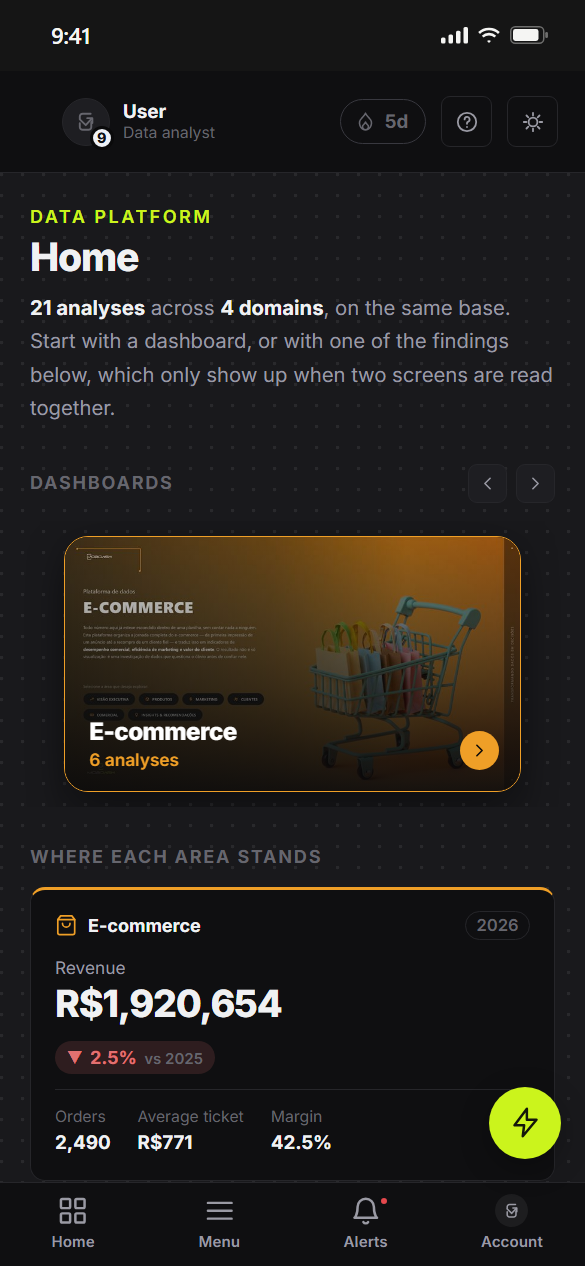
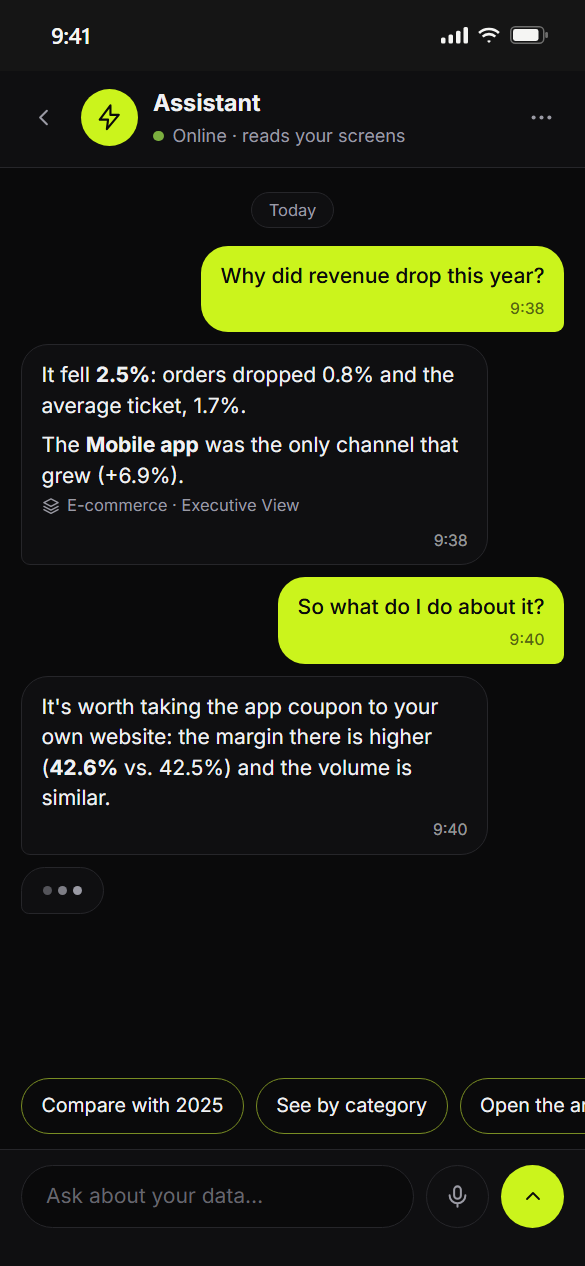
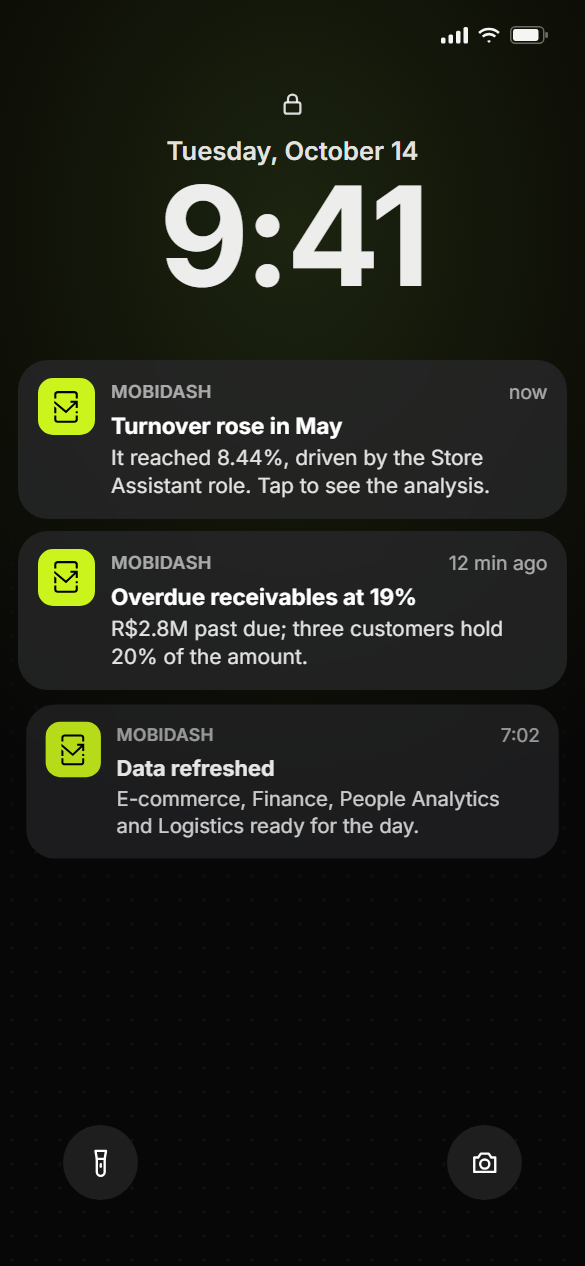
Sample app with demo data.
The dashboard goes where decisions happen.
Screens, metrics and names the way your company talks. Nothing comes from a ready-made template.
Your brand, your colors and your name on the screen of whoever decides.
The board sees the consolidated view; each manager, their own area. Access follows the role.
Solutions
Before the dashboard comes the part no one sees: bringing together what is scattered and making sure the number adds up.
ETL
Data warehouseDW
From the data warehouse to the decision
Each metric defined once and read the same way by every area.
They watch the metrics and explain the change before anyone asks.
The report someone used to build by hand now arrives on its own.
A single dictionary, from operations to the board.
Every system stores data its own way. We build the pipelines that fetch, clean and load everything (the ETL) into a data warehouse: a single database, with an organized history, that every dashboard reads from. Loads are monitored, and a failure raises an alert before a wrong number goes out.
Impact calculator
Adjust it to your company's reality. The math is simple and transparent — and it is the starting point of our diagnostic.
Estimated annual impact
$259K
Rework = people × hours per week × 48 weeks × cost per hour. Gain = annual revenue × efficiency entered. Estimate based only on the values you enter.
I want the full diagnosticWho already decides with data
Nós temos uma particularidade: um sistema que controla o nosso financeiro, outro que controla nossos estoques, faturamento e marketplaces, outro com o nosso CRM e mais alguns no meio do caminho. Cada um contava só uma parte da história. A Mobidash juntou tudo num lugar só, e hoje a gente olha a empresa inteira, em vez de abrir um relatório para cada sistema.
 Translaser
Nossa gestão de vendas e o financeiro ficavam visíveis apenas dentro da nossa sede. Em 2023 tivemos uma mudança de sistemas e precisamos juntar os dados que estavam em uma planilha de Excel com os dados atuais. Hoje temos comparações entre períodos que nos dão um poder de decisão melhor, em qualquer lugar e a qualquer momento.
 Ermida
We used to manage inventory and sales by hand, in a notebook, and then move everything into an Excel spreadsheet. Today we have a fully manageable, multi-platform system.
 JR3D Printer
How we work
We understand the business challenges, listen to the operation and map data sources, processes and the questions each area needs to answer.
Deliverables
We define the architecture, the metrics and the order of deliveries — each delivery with visible value for the business.
Deliverables
We build the whole path — integrations, database, dashboards and automations — in incremental deliveries, the way the operation needs.
Deliverables
We check the numbers with your team until they match reality — trust in the data is non-negotiable.
Deliverables
We make sure your team uses what was built in their day-to-day work, with training and advisory follow-up.
Deliverables
Cases
SaaS · Embedded BI
7,000+
active users on a multi-tenant BI product, with standardized KPIs and embedded analytics — it became a new recurring revenue line.
Pharma · Market intelligence
1,200+
users working with pharmaceutical market models built on market audit databases.
Transportation · ETL + DW
4x/day
orders updated automatically, integrating ERP, finance and CRM into a data warehouse — with failure alerts and data ready before the dashboards refresh.
Figures from projects delivered by Mobidash.
Frequently asked questions
With a free initial diagnostic: we understand the scenario, the data sources and the questions the business needs to answer, and suggest the best structure.
No. We build the whole path, making sure the data is organized and reliable before it reaches the screen — from integration to dashboard.
That is our day-to-day. We integrate different sources — ERP, CRM, e-commerce, spreadsheets, APIs — and bring everything together in one place.
Yes. We optimize the data model, review the calculations and apply good performance and governance practices.
Yes. We build automations and AI agents that take manual work out of the way and make the team more efficient.